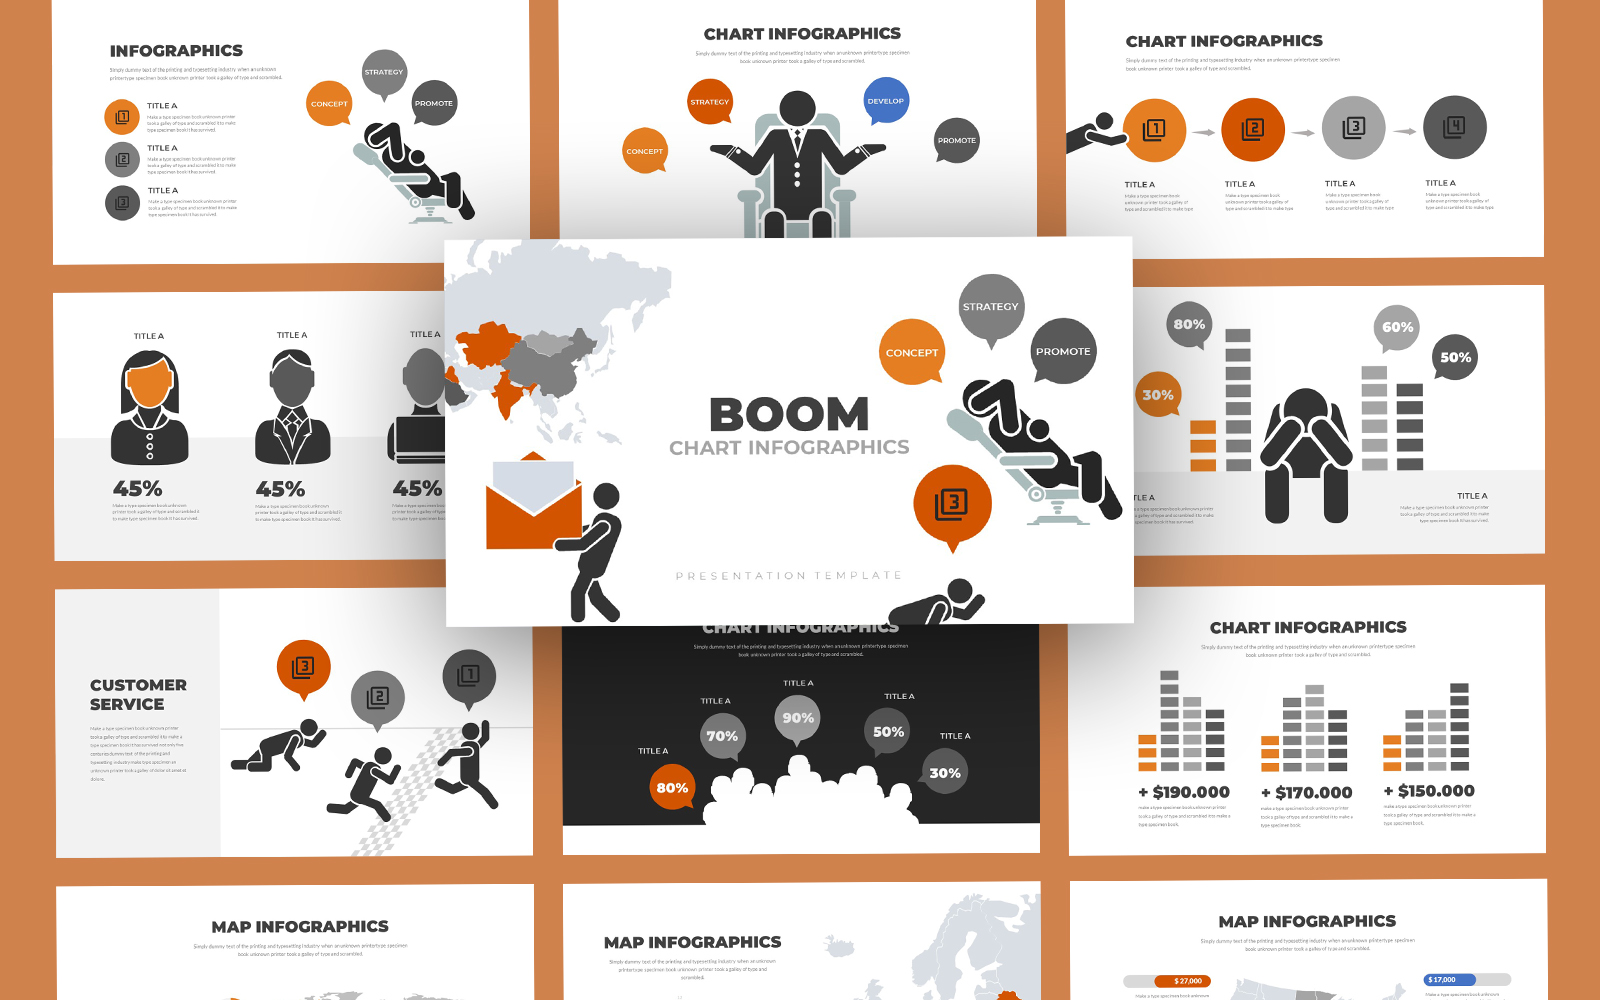
Plantilla de diapositivas de Google Boom Chart Infographic Analytics

Descripción Corta:
Boom Chart Infographic Analytics Google Slides Template Flat, Clean, Minimalist, Elegant and Flexible Presentation Template.
Designed to match professional business scope with various infographics topics you can choose such as,
Creative Agency, Company Profile, Corporate and Business, Portfolio, Photography, Pitch Deck, Startup,
and also can be used for Personal Portfolio.
Main Features
- 62 Unique Slides
- 4 Color Variation Ready to Use
- All graphics resizable and editable
- Used and recommended free web fonts
- Based on Master Slides
- 16:9 Aspect Ratio
- Icons variation are included
- Drag and drop image to screen mockups
- Fully editable text
- Free Support
Note: All Image Stocks not included . But if you need information about these image stocks, feel free to contact me.
Color: black, white, grey, orange,tags: agency, business, clean, company, corporate, creative, diagram, elegant, map, marketing, mockup, modern, multipurpose, portfolio, presentation, simple, template, infographic, business plan, pitch deck,
Tema: Marketing Agency Templates, Advertising Agency Templates, SEO Website Templates, Business & Services,
-
Gratis 24/7
Equipo de Soporte -
Soluciones
Desde el Cero -
Calidad
Premium -
1 200 000+
Clientes Satisfechos
| Plantilla # | 302475 |
| Tipo: | Google Slides |
| Autor: | graphtemp |
| Descargas: | 0 |
| Plantilla # | 302475 |
| Tipo: | Google Slides |
| Autor: | graphtemp |
| Descargas: | 0 |


